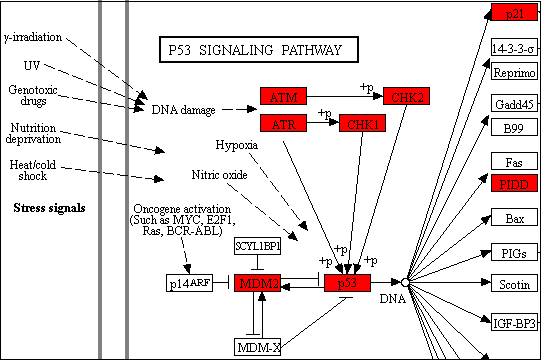
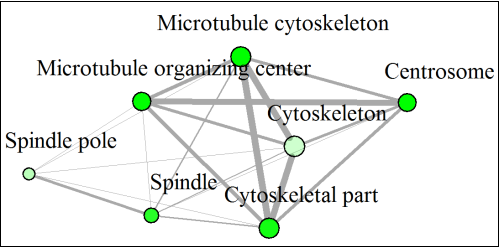
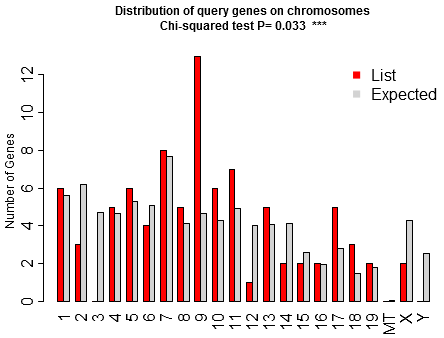
Welcome to ShinyGO! Just paste your gene list to get enriched GO terms and othe pathways for over 200 plant and animal species. In addition, it also produces KEGG pathway diagrams with your genes highlighted, hierarchical clustering trees and networks summarizing overlapping terms/pathways, protein-protein interaction networks, gene characterristics plots, and enriched promoter motifs. See example outputs below:


Download table with gene IDs

Select KEGG pathways in the left to display pathway diagrams.


Download
ShinyGO tries to match your species with the 115 archaeal, 1678 bacterial, and 238 eukaryotic species in the STRING server and send the genes. If it is running, please wait until it finishes. This can take 5 minutes, especially for the first time when iDEP downloads large annotation files.


Download
For Details please see our manuscript and a detailed demo.
Based on annotation of 163 animal and 45 plant genomes in Ensembl BioMart as of 12/15/2017. Additional data from MSigDB (human), GSKB (mouse) and araPath (arabidopsis). Full list of supported organisms For feedbacks or data contributions, please contact us, or visit our homepage.
ShinyGO shares many functionalities and databases with iDEP.

Input:

A list of gene ids, separated by tab, space, comma or new line characters.

Output:

Enriched GO terms and pathways:


In addition to the enrichment table, a set of plots are produced. If KEGG database is choosen, then enriched pathway diagrams are shown, with user's genes highlighted. Like this one below:


Many GO terms are related. Some are even redundant, like "cell cycle" and "cell cycle process". To visualize such relatedness in enrichment results, we use a hierarchical clustering tree and network. In this tree below, related GO terms are grouped together based on how many genes they share. The size of the solid circle corresponds to the enrichment FDR.


In this network below, each node represent a enriched GO term. Related GO terms are connected by a line, whose thickness reflect percent of overlapping genes. Size of the node corresponds to number of genes.


Through API access to STRING-db, we also retrieve protein-protein interaction (PPI) network. In addition to a static network image, users can also get access to an interactive graphics at the www.string-db.org web server.


ShinyGO also detects transcription factor (TF) binding motifs enriched in the promoters of user's genes.


Changes:

4/24/2018: V0.4 Add STRING API, KEGG diagram, tree display and network. 4/27/2018: V0.41 Change to ggplot2, add grid and gridExtra packages 4/30/2018: V0.42 changed figure configurations for tree.